Analyzing Bangladesh's Stock Market Cycles: From Peaks to Drawdowns (2010-2024)

By Asif Khan, CFA
Chairman
EDGE AMC Limited
Posted on: 10 Apr, 2024
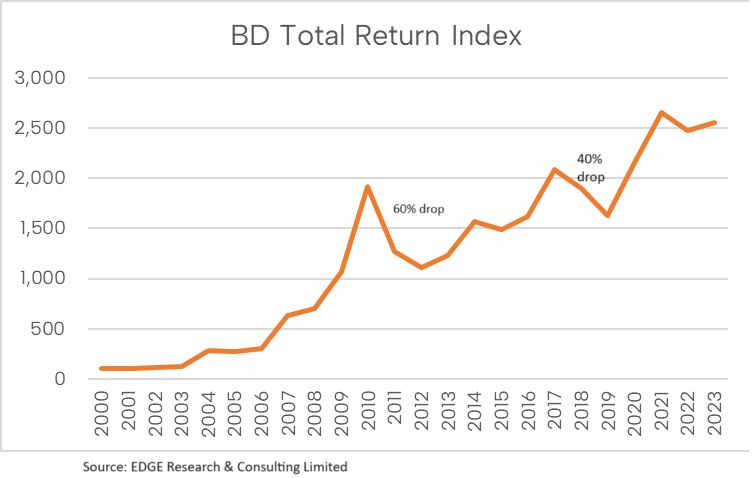
After the peak of 2010, the stock market in Bangladesh fell by around 60% before turning around. The next peak came in around 2017, after which the index fell around 40%. The latest peak was during the post-COVID liquidity frenzy of 2021. The drop in index values is summarized below
CASPI : -26%
DSEX : -25%
DS30: -30%
It is important to recognize that just because the market fell a certain % in a previous cycle it may not happen like that again. The period between 2010 to 2024 (Present) had a sideways market, unlike the up-trending market of 2000-2010. As a result, we saw boom and bust cycles more frequently.
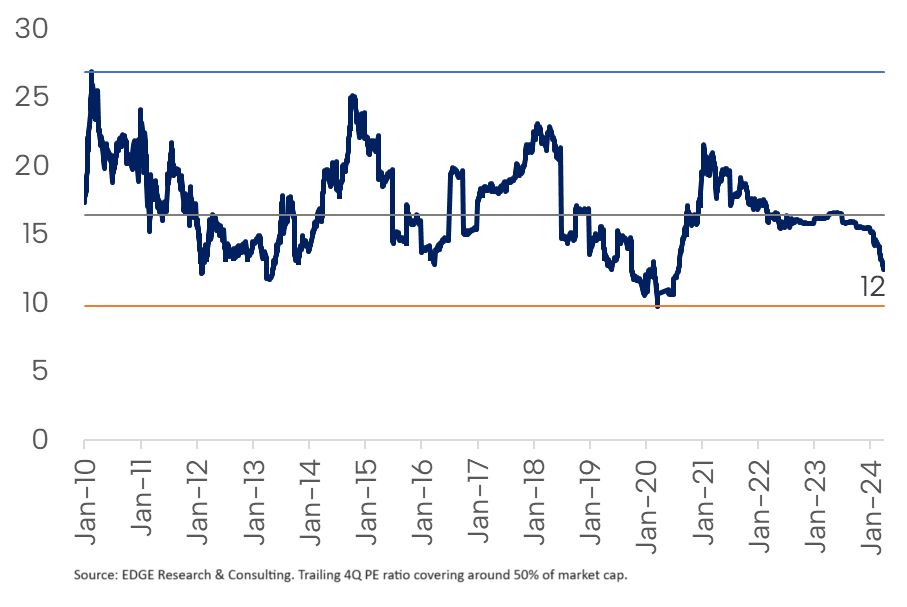
It is also important to be cognizant of valuation levels. The significant drawdown after 2010 can be explained by the extremely high valuation levels. PE ratio was around 29x back then. In contrast, the 2017 peak had a PE ratio of 23x (still high but not as much as 2010). The latest peak of 2021 had a PE ratio of 21x.
The PE ratio chart is till the end of March 2024. Using April numbers would show something closer to 11x and bring it very close to the all-time low of 10x that we saw during the COVID-19 pandemic.
Note: The total return chart below uses the year-end numbers resulting in a smoother line.


- Tags:
- Bangladesh stock market, CASPI, DSEX, DS30, market cycles, investment analysis, PE ratio, stock market trends, economic outlook, financial markets, valuation levels, historical performance
Search
Categories
Recent Post
-
EDGE Government Security Index (EDGEGSI) Starts 2025 with Strongest January Gain Since 2010
18 Feb, 2025 -
Analyzing September 2024 Inflation: Signs of Easing Price Pressures Amid Base Effects
03 Oct, 2024 -
Bangladesh Equity Market Outlook: Low Valuations and Future Growth Potential Amid Political and Economic Uncertainty
02 Oct, 2024 -
Assessing Currency Risks for Bangladesh: Why the Worst May Be Over for the BDT
29 Sep, 2024 -
Bangladesh 10Y Bond Yield Spread Hits 8.71%: Exploring the Investment Potential and FX Risk
28 Sep, 2024
Have Any Question?
If you have any questions feel free to reach out to us via phone or email.